
The Showbudget Panel and Optimizing Source Levels
(October 1, 2017)
In the Quake and GoldSrc days, mappers relied on the r_speeds command for metrics on how their maps ran. r_speeds is rather basic, showing you the length of time it takes to render a frame, the amount of world polygons being rendered, entity polygons being rendered, and the number of dynamically-lit surfaces on screen. There's not a lot of nuance in the metrics with r_speeds, just try to render fewer objects on screen and hope for the best.
Source has a much more detailed and advanced way of showing you what's eating at your framerate. Likely, you don't even know about it, given how hidden away it is. Enter the Showbudget panel.
Breaking down the Showbudget panel
Showbudget uses a set of bars on a graph to show you how long each part of the engine is taking to process. To enable it, enable cheats and enter +showbudget into the console. -showbudget will hide it. We recommend you bind +showbudget to a key, so you can hold it down at any time and see its measurements.
So before we go any further, it's a good idea to talk about the math behind your frames per second. Your FPS count can be determined by how many milliseconds it takes to render out each frame. This is what the Showbudget panel measures. PC gamers often talk about 60fps being something of a necessity, but in order to reach that as a minimum, each frame needs to take less than 16ms to render. For 30fps, considered the playable minimum, each frame needs to take less than 33ms to render. That's game logic, networking, world rendering, physics, particle systems, dynamic lighting, texture caching—all in the span of 16ms. For reference, the time it takes for a human to blink is between 100ms and 400ms.

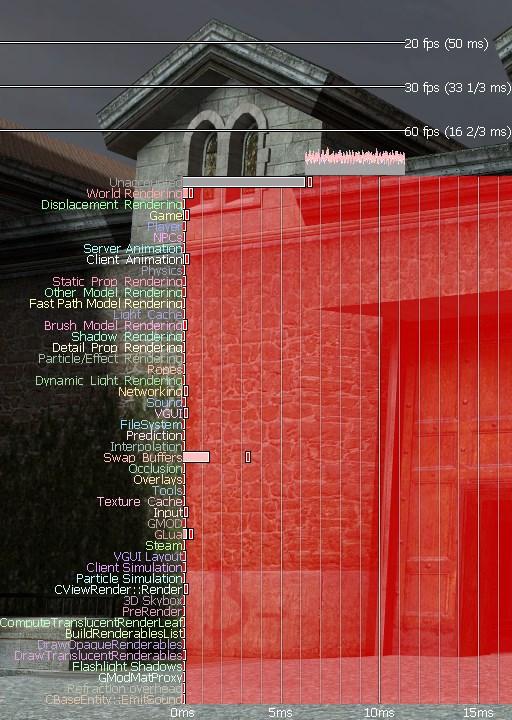
dm_resistanceWhen you first enable the Showbudget panel, it'll look a bit cramped and unreadable. Setting the console variable budget_panel_height higher should clear that up. From here, you'll be greeted with two graphs. The top graph is an FPS indicator. Three lines mark 20fps, 30fps, and 60fps on this graph. The taller the indicator, the lower your framerate. If the indicator is under all three lines, congratulations, you're getting over 60fps. If not, it's time to figure out why.
Below it is a bar graph of different engine systems; the longer the bar, the more time each system is taking to process its data. Explaining the purpose of each bar in the second graph would be too long-winded for this introduction. You can find the full reference listing on Valve's Developer Community site. For now, we'll be looking at a few meters in particular that are often likely culprits.
Unaccounted
The Unaccounted meter is a curiosity, as it doesn't necessarily measure anything in-game. Programs running in the background can contribute to the Unaccounted meter. Frame limiting can account for a large Unaccounted meter. You can try and reduce this by closing any other programs you have open (Hammer is a big one) and increasing the value of fps_max, but ultimately, this meter is not the fault of your map.
World Rendering
The World Rendering meter also accounts for cubemap density. If this meter seems unusually high, try to lower the density of your cubemaps.
Physics calculations
It's a given, especially if you like to screw around with ragdolls or oil barrels in Garry's Mod. Too many physics calculations will cause massive decreases in framerate. If you're creating a custom map and you're looking to get this bar smaller, however, it's likely because of too many physics props, such as tables, colliding with other props in contact with them.
The solution is either to use static props (which are built into the world, don't move, and are cheaper to calculate) or to set some of your physics props to start "asleep". In the spawnflags for your physics prop, check "Start Asleep". This means the prop will not move unless it's acted on by the player. Careful, however, as the prop will hover in the air if it's not properly placed on the ground.

Physics constraints, such as the traps in Ravenholm, will also add to this meter.
Swap buffers
One of the most cryptic meters on the entire graph, the Swap Buffers meter refers to one of two things, your fillrate and your resolution. Fillrate refers to the amount of expensive objects on screen that take multiple rendering passes. All the things that make a texture look fancier, including bump mapping, refraction (the way water or frosted glass distorts the shape of things viewed through it), and specular highlights on shiny surfaces contribute to its fillrate. Each overlapping effect, along with the initial pass of the texture itself, increases the fillrate. Many particles overlapping one another (like fire and smoke) will also heavily affect the fillrate. Simplify these textures down and reduce the amount of overlapping particles if this is the case.
The other thing that could increase the Swap Buffers meter is the resolution at which you run the game at. Running the game in a window at 720p is obviously much faster than running it fullscreen at 4k. Even if you reduce the resolution of the game in the settings, if you're running it fullscreen, it will still be rendered at your monitor's maximum resolution. If your monitor supports up to 1080p, running the game at 720p simply makes the 720p image fit a 1080p space, blurring it and solving nothing. The solution in this case is just to run it in a window at a smaller resolution. Notice the reduction of the Swap Buffers meter (and the increase in speed) with the game running at 1080p windowed versus running it at 2560x1440 fullscreen:

To this end, you should be able to get a solid framerate throughout your map at a resolution of 1080p or above. If you can, you can reasonably expect most players not to have an issue with your map either.
Other ways to optimize your map
For the most part, the other meters can be reduced simply by removing some of whatever needs to be removed. If you have a lot of NPCs on screen, for instance, not only is that entity logic and "thinking", but it's also rendering extremely complex, high poly, jointed models with inverse kinematics. If your map is running too slow with them, reduce the NPC count. If you have too many overlays, reduce the overlay density in a certain area.
Visibility control is important too; too many models being rendered at one time can be solved using an areaportal or an occluder, and VVIS will also help decrease the amount of things being rendered at once. This is another area where having a map leak can negatively impact performance, as VVIS won't run on maps with a leak.
Remember that your goal, if you're shooting for a rock-solid 60fps, is 16ms per frame. If you're failing to get a stable framerate in a certain area, it's time to simplify it down. This goes doubly so for games such as Garry's Mod, where you have to account for the player's actions and the props and items they spawn as well as what it's in the map to begin with.